Increase in Supply Chain Breaches
Audit Export
Per Vendor
Refresh Cadence
Conventional encryption leaves a trail. Attackers know exactly where to look.
The board does not want a feature list. They want a list of who is putting the business at risk, sorted by severity, with a defensible answer to the next question.
Three steps from vendor blind spot to executive clarity.
No engineering scramble. No vendor pushback. No quarterly fire drill. The Enterprise Dashboard starts producing answers your CFO and board can act on within the first week.

Vendors connect with a read only access, in minutes, not quarters.
No procurement battles, no architecture reviews, no impact on your vendors' velocity. Protected through our patented process

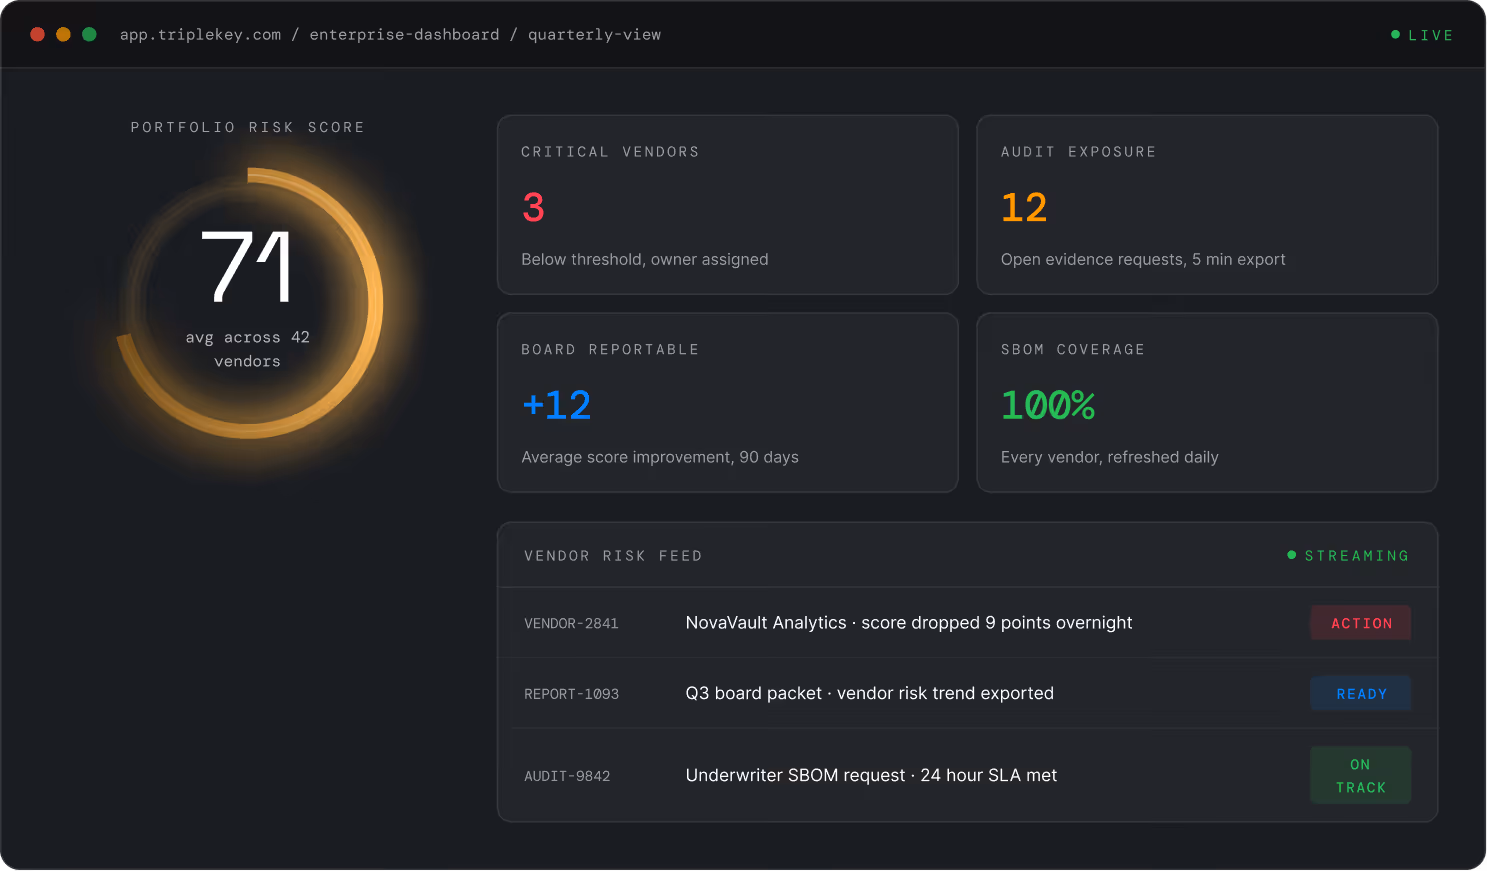
Every vendor becomes one number your board can read.
We translate every risk, license conflict, and contributor anomaly across your vendor stack into a single risk score per vendor, refreshed daily.

Defensible answers, the moment a question lands.
The board asks who is putting you at risk. Your underwriter asks for vendor evidence. Your auditor asks for an SBOM. You answer the same day, with data.
Three audiences. One dashboard. One source of truth.
The Enterprise Dashboard is built so your board, your auditors, and your underwriters can all read the same vendor risk view, draw the same conclusion, and ask the same next question.

Visibility
Most organizations can name their top vendors but cannot answer the next question, which one is most likely to cause us a breach. The Enterprise Dashboard ranks them for you, in plain language, refreshed daily.
- Single risk score per vendor, refreshed dail
- Sortable, filterable, scannable in under a minute
- Plain language explanations for every change
- No technical credential required, ever

Defensibility
Regulators, cyber insurance underwriters, and acquirers expect documented oversight of your software supply chain, not annual questionnaires. The Enterprise Dashboard produces the evidence on demand.
- Date stamped vendor oversight evidence on demand
- SBOM coverage across 100% of monitored vendors
- Insurance and M&A diligence ready, without fire drills
- Five minute export, sharable with auditors directly

Communication
Stop walking your board through general statements about cyber posture. Show them a single number per vendor, a trend line over time, and a clear story of which risks are rising and which have been retired.
- Quarterly board view, generated automatically
- Ninety day trend on every vendor in the portfolio
- Sharable views for CFO, GC, and audit committee
- No jargon, no acronyms, no engineering required
The numbers behind the product
Rise in software supply chain breaches over the last two years.
To produce an audit ready vendor risk export, on demand.
Vendor SBOM coverage, refreshed daily, ready for the board.
Per vendor and one Portfolio Score across the entire ecosystem.

Maintaining patient trust means staying ahead of threats we couldn't previously see. By leveraging TripleKey we obtain that additional visibility and control. We're securing our operations and reinforcing our commitment to safety and resilience.
Patrick McGill, MD
Chief Executive Officer
Community Health Network

Your vendor blind spot has a price tag, and it shows up on your board deck.
In a thirty minute demo, we'll show you the vendor risk view your board would see today, the audit evidence you could be exporting tomorrow, and the trend line your CFO can take to the next quarterly meeting.
Forensic visibility into every vendor in your software supply chain.
Codebases at Risk
CVEs in 2026 (Projected)
Avg Starting Score
Scan Cadence

Every vendor. Every repo. Every CVE. One queue.
Sort by score, severity, advisory age, or category. Pivot to the offending file in three clicks. Push findings into your SIEM, GRC, or ticketing tool through native integrations or REST API.
Out of pipeline by design. Across every vendor in your stack.
The Enterprise Dashboard runs on TripleKey's patented out of pipeline architecture. A read only repo token from each vendor is the entire integration footprint. Your engineers do nothing. Their engineers do nothing.
Read only tokens, no pipeline access, no agents.
Each vendor grants a read only token to TripleKey. We never sit inside their build process, their CI, or their runtime. Zero blast radius.
Daily SCA across every vendor, every repo, every dependency.
Manifest parsing, lockfile analysis, dependency graph traversal, advisory matching against the full disclosed CVE corpus, severity weighting tied to exploit availability. Every package, every twenty four hours.

One ranked queue, every morning, ready for triage.
Vendors sorted by score, drill down to the offending repo and CVE in three clicks, and a 90 day trend on every vendor and the portfolio as a whole.
Forensic depth on every vendor in your stack.
The Enterprise Dashboard is built so your board, your auditors, and your underwriters can all read the same vendor risk view, draw the same conclusion, and ask the same next question.
Forensic Risk
For every vendor in your portfolio, daily scans against the full disclosed CVE corpus (over 345,000 cumulative, with 59,000+ new ones projected in 2026 alone), severity prioritization tied to exploit availability, and surfaced credentials, API keys, and secrets sitting in vendor code.
- Daily scans against every disclosed CVE, all 345,000+ of them
- Exploit availability weighted into severity score
- Plain language explanations for every change
Portfolio View
One queue across the entire vendor ecosystem. Sort by score, severity, advisory age, or category. Drill from a ranked vendor to the offending repo to the underlying CVE in three clicks. Built for the way your security analysts actually triage.
- Sortable, filterable view of every monitored vendor
- One Portfolio Risk Score across the full ecosystem
Continuous Monitoring
Every vendor in the portfolio is rescanned every 24 hours. Score changes, new advisories, and threshold crossings surface the moment they happen, with a rolling 90 day trend on every vendor and the portfolio as a whole.
- Daily rescans across every monitored vendor
- Threshold based alerts on score drops and new criticals
- 90 day trend per vendor and across the portfolio
The numbers behind the product
CVEs published in 2025, a 21% jump over 2024 and a new annual record.
CVEs projected for 2026 by FIRST, the first year ever to exceed 50,000.
Projected new CVEs disclosed every day in 2026, more than double the rate just five years ago.
Median TTE. 56% of vulnerabilities weaponized within the first month of disclosure.
Maintaining patient trust means staying ahead of threats we couldn't previously see. By leveraging TripleKey we obtain that additional visibility and control. We're securing our operations and reinforcing our commitment to safety and resilience.
Patrick McGill, MD
Chief Transformation Officer
Community Health Network